Keep Your Website Visitors Hooked: How Market Data Graphs Elevate Your Real Estate Website

The Real Challenge: Engagement, Not Just Traffic
You’ve been driving hard for your real estate site. Search engine optimization is in place, social media presence is steadily increasing, and marketing efforts seem to be paying off, considering the inflow of visitors. And yet, here’s the uncomfortable truth: Getting people to your site is only half the battle. 😟
Today’s short-attention-spanned visitors will bounce within seconds if they don’t instantly see the value. When potential clients have dozens of alternatives available at their fingertips, you need to have something that makes them stay, engage, and eventually reach out to you.
Your Secret Weapon: Market Data Visualization 📊

Think about what homebuyers and sellers are really asking when they research an area: “How’s the market doing here?” “Are prices going up or down?” “Is inventory tight or plentiful?” 🤔 Most real estate websites make people work too hard to find these answers. They either bury that critical info in reams of text, or present mind-numbingly obscure data tables that require serious analysis to get anywhere near answering those simple questions.
This is where market data graphs become a game-changer for your website experience. 🚀
Tips for Keeping Visitors on Your Site Instead of Clicking Away

If people cannot find the information they are looking for about markets on your site, where do you think they will go next? To other competitors who do have the information. Once they leave, it is unlikely that they will return. By embedding relevant market data visualizations right on your community pages and blog posts, you are thus creating a ‘sticky’ website experience. You answer their questions before they must go elsewhere for information, significantly increasing time on page and reducing bounce rates. 👍
In real estate, trust is everything. When you give your clients accurate market visualizations, you are conveying several strong messages: “I understand what information matters to you.” “I am transparent about the market conditions even if they are challenging.” “I am tech-savvy and interested in providing a modern experience.” “I am a data-informed professional to guide your decisions.” Such unspoken credibility goes beyond any conversation with prospective clients. They begin to view you as a trusted resource rather than just one more agent fighting for their business.
Practical Implementation with the Data Graph Widget: Easier Than You Think 😊
Worried this sounds technically complicated or expensive? Relax! Adding powerful, professional-looking market graphs to your site doesn’t require advanced coding skills or a hefty budget, especially if you’re already leveraging the power of IDX Broker.
For agents looking for a seamless solution, tools like the Data Graph Widget make this incredibly straightforward. Here’s why it’s simpler than you might imagine:
- Direct IDX Broker Integration: The Data Graph Widget is designed to work directly with your existing IDX Broker Saved Links. This means it pulls data straight from your MLS feed based on the precise criteria (neighborhoods, property types, price ranges) you’ve already defined. No manual data entry needed!
- User-Friendly Setup: You configure the widget through a simple online interface. Typically, you just:
- Give your graph a name.
- Select the specific Saved Link you want to visualize.
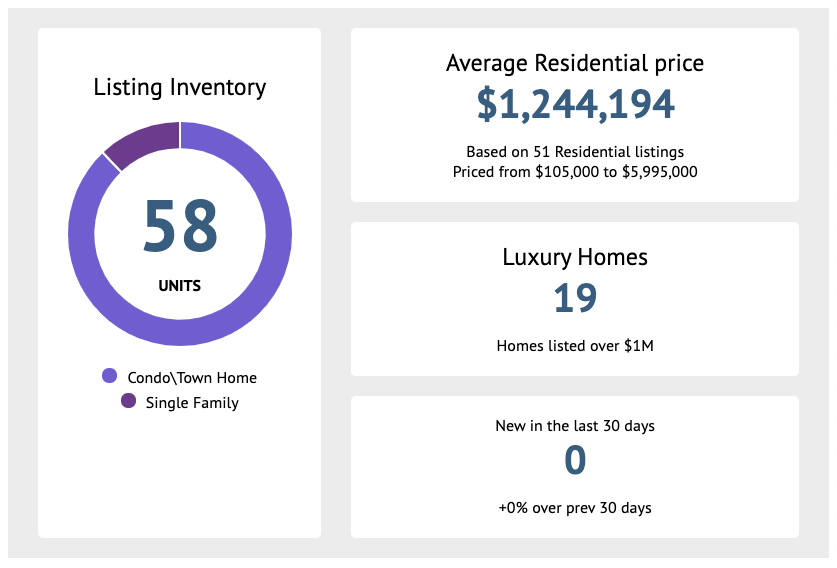
- Choose the key data points to display (Maybe even filter for Luxury Homes or see data for a specific timeframe like the last 30 days).
- Pick a color scheme to match your website’s branding.
- Simple Code Snippet: Once configured, the tool generates a small piece of code (a script tag). You just copy this snippet.
- Universal Compatibility: The beauty is that you can paste this code snippet virtually anywhere you can add HTML or scripts on your website – whether it’s built on WordPress, Squarespace, Wix, Webflow, a custom platform, or even within specific page builders.
Setting up your first Data Graph Widget genuinely takes just a few minutes, not hours or days. Yet, the visual upgrade and the informational value it immediately adds to your website are significant. ✨
Turning Engagement into Opportunity

In today’s competitive real estate landscape, the difference between a website that generates leads and one that exists comes down to user experience. By leveraging the power of visual market data, you’re not just decorating your website—you’re transforming how potential clients interact with your brand and positioning yourself as their trusted local market expert. 🏆